


Efficient Power Measurement and Analysis, Part 2
Source: Probemart 2026-07-07 Views: 94
Harmonics
Current harmonics occur when nonlinear devices distort the current flowing into the circuit.. Linear circuits draw current only at the fundamental power frequency, but nonlinear circuits draw current at multiples of the fundamental frequency, and each harmonic has a different amplitude and phase.
Voltage distortion occurs when current and harmonics flow through the impedance of the power distribution system. Heat accumulates in cables and transformers, and as the number of switched-mode power supplies connected to the grid increases, harmonic distortion on the grid also increases.
Therefore, multiple standards have been designed in the industry to limit the impact of nonlinear loads on power quality. The industry has developedIEC61000-3-2andMIL-STD-1399and similar standards to limit harmonics.
IEC61000-3-2The standard limits the current harmonics injected into the mains supply system. It applies to equipment with a maximum input current per phase of16A, connected to a public low-voltage distribution system (230V ACor415V ACthree-phase) all electrical and electronic equipment. The standard is further divided intoAClass (balanced three-phase equipment),BClass (portable tools),CClass (lighting equipment and dimming devices) and DClass (equipment with unique current waveform requirements).
MIL-STD-1399sets technical specifications and test requirements for equipment (loads) to maintain compatibility with shipboardACpower systems, from computers and communication equipment to air conditioners。

Figure 1 Setting up basic current harmonic analysis requires only a few simple settings. This example shows the setup for precompliance checks against industry standards
4/5/6-PWRThe analysis application enables easy measurement of current harmonics. It can display measurement results in tabular and graphical form. Designers can also quickly compare device performance with the standards to be met before certification, because certification usually takes considerable time and is very costly. Providing measurement capability in the oscilloscope not only speeds up debugging but also helps avoid changing the design at the final stage to meet regulatory requirements.

Figure 2 Use4/5/6-PWRHarmonic results obtained. The nonsinusoidal current waveform and harmonics can be seen at the lower right. The harmonic bar graph displays the harmonic content in decibels. Odd harmonics are most prominent but fall entirely withinIEC 61000-3-2the limit range
Perform measurement
Use a differential voltage probe to measure the line-frequency voltage and a current probe to measure the line-frequency current.
If you want to compare the harmonics in the design withIEC 61000-3-2the limits in the standard, then the line frequency must be determined,mustselect the class type. InCclass andDclass standards, the input power, power factor, and fundamental current also need to be entered into the system. The analysis software package will load a predetermined limit table, compare the measured harmonics with the limits, and then display the pre-compliance test results, as3shown.

Figure 3 can graphically display up to400harmonics. The table showsIEC 61000-3-2Pre-compliance test results. Depending on the settings, the analysis software package loads the predefined limit table and compares each measured harmonic with the limits
Measurement results
• ResultsThe tab displays the selected harmonic standard, the fundamental harmonic, and the third-order harmonic amplitudes,THD-F、THD-R、RMSvalue and pass/fail status.
• Individual harmonics can be selected; the measured values are linked among the results tab, bar chart, and results table.
• The harmonic table includes:
- Selected harmonic standard
- Harmonic number and frequency
- Amplitude (RMS): measured harmonicRMSamplitude value, in units ofdBμAorA
- Amplitude (%): measured harmonic amplitude relative to the fundamental frequency
- Phase: harmonic phase relative to the frequency reference, in degrees
- Limit: harmonic limit specified by the designated standard
- Status: pre-compliance test passed/Failure status
- Margin: difference between the measured value and the limit
• Current harmonics can be displayed in decibel-microamperes (dBμA) or amperes (A) as the unit

Figure 4 on channel7current, perform automatic inrush current measurement and capacitance measurement
Surge current and input capacitance
Typically, surge current occurs on first power-up. A power converter draws a relatively high current while its input capacitance charges. After the initial surge, the current remains in a steady state unless other system changes occur. Surge current measurement provides important information about the power-supply design, including the sizing of protection devices. In extreme cases, surge current can cause AC line voltage sag.
This power analysis software supports automatic surge measurement. The power analysis software identifies the surge region and marks it on the display, and finally calculates the surge current within that region.
Because the oscilloscope digitizes the voltage and current waveforms, the software can also find charge by integrating current, then use the equation c=q/v to measure the input capacitance of the system. In addition to analyzing power-supply startup characteristics, dynamic capacitance measurement also helps analyze gate-charging behavior in switching devices. Compared with other capacitance measurement techniques, we use instantaneous current and voltage waveforms to measure total capacitance under operating conditions.
Surge current and input capacitance are directly related, and both provide important detailed information that lets engineers fully understand the startup characteristics of power converters.

Figure 5 A surge occurs when power is turned on. The current waveform shows a gradually decreasing peak before reaching steady state

Figure 6 Using4/5/6-PWRto perform switching loss measurements. Multiply the current and voltage to obtain instantaneous power, yielding the upper trace (orange)
Loss measurements are performed on the instantaneous power waveform. Each loss region is marked with a colored marker, and the markers correspond to the measurement labels. The bottom waveform is the voltage across the switch and the current flowing through the switch.
Switching analysis
Measurements during the power-switching phase confirm whether the converter operates correctly, quantify loss sources, and verify that devices operate within normal ranges.
Switching loss measurement
When various physical capacitors and parasitic capacitors charge, turn-on loss occurs; inductors generate magnetic fields, and associated transient resistive losses occur. Similarly, when the switching power supply is turned off, even if the AC mains has been unplugged, energy is still discharged and interacts with various components, so losses also occur.
Making measurements
To perform switching loss measurements, the oscilloscope must measure the voltage across the switch and the current flowing through the device. The switching loss results are shown in the figure6as shown.
Measurement results
• Ton: mean of the turn-on power and energy-loss values per cycle
• Toff: turn-off power and energy-loss values per cycle
• Total: total average power loss and average energy value per cycle
• The left and right arrow buttons can traverse the switching cycles and zoom in to inspect problem areas.
• Measurement data can also be viewed in the results table. This table displays the cumulative measurement results for all switching cycles for quick verification.

Figure 7 Rds(on) measurement Ch1(yellow) waveform isFET V DSvoltage,Ch2(cyan) waveform isFETcurrent. The waveform will be phase-inverted to correctly indicate that the current in the conduction region is larger. The “Math” function will plotRDSonvalue, and the result label will display the minimum calculated from the math waveformRDSonvalue. In the case shown, it is1.13mOhms
Rds(on)
When the switching device is in the on state and conducting current, this measurement can analyze the drain-to-source resistance characteristic. Dynamic on-resistance is the ratio of the voltage across the device when it is on to the current flowing through the device. You can use the cursor gating function to accurately measureRDS(on), which is an important cause of loss in switching devices.

Figure 8 safe operating area of the transistor(SOA)Figure
safe operating area
safe operating area of the switching transistor (SOA) determines the current that can safely flow through the transistor at a given voltage.SOAis usually specified in the product datasheets ofBJT、MOSFETorIGBTswitching transistors. It is represented asVCE(forFETisVDS) versusICE(orIDS ) relationship graph that describes the range within which the transistor can operate without degradation or damage.
Power analysis software can upload the device product datasheet'sSOAto4SeriesB MSOin which you can then measure voltage and current on the actual device. The oscilloscope recordsV-Iplot, which can indicate whether any parameter exceedsSOA。
perform measurements
When operating a transistor in a power supply, determining the transistor'sSOAone of the main challenges is accurately capturing voltage and current data under various load scenarios, temperature variations, and line-frequency input voltage changes.4/5/6-PWRautomates data capture and analysis, simplifying this task. The measurement requires probing the voltage across the switching transistor and the current flowing through it.
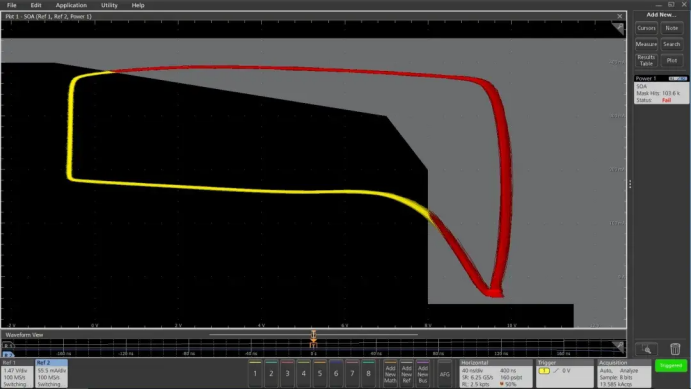
Figure 9 Using4/5/6-PWRto performSOAtesting. If data points fall within the template region, they are yellow, indicating “pass”; if they fall outside the template region, they are red, indicating “fail”. In this example,V-Icurve fallsSOAoutside, indicating that the switching device is subjected to excessive stress
The next step is to set up theSOAtemplate, as shown in15shown,SOAThe template editor allows entry of the transistor'sSOAlimits; the limits are determined in the transistor datasheet or by your own criteria.

Figure 10 SOAtemplate editor window. The template is determined by a set of (voltage , current) coordinates; the coordinates come from the switching device datasheet or can be determined by the user.
Measurement results
After setup is complete, the SOA test results are displayed, as shown in9shown.The voltage and current waveforms are plotted in a single record in XY mode. The plot shows all data for one acquisition cycle.
The Results tab shows the number of times the device falls outside the SOA template and gives a pass/fail test result.
Reprinted from Tektronix

PCIM Europe 2026, Nuremberg: IWATSU and PMK at Booth H7-157
2026-06-15
APEC 2026: 41st IEEE Applied Power Electronics Conference and Exposition
2026-03-15
Semicon China 2026, Shanghai New International Expo Centre (SNIEC)
2026-03-11
WiPDA Asia 2025, Beijing International Convention Center, 15 August
2025-08-06